Saturday, March 28, 2015

Out For a While

Well, it’s been a while since I’ve written here. It’s been a goal of mine to write a post once in a while, and I’m finally doing it. Hopefully I will have time to write at least once a month from here on out.

One of the biggest questions every year for the Rockies, is whether or not Troy Tulowitzki will stay healthy. The optimist in me says it’s more likely that he stays on the field than most people expect, so I decided to take a closer look at Tulo’s injury possibilities.

When looking at injuries, there are four scenarios that could happen and have happened to Tulo in his career. The first is that he stays off the DL for the entire season. This occurred in 2007, 2009, and 2011. I’ve included 2011 in this category although he missed 14 out the last 19 games, since he was never out more than 6 in a row.

The second is that he has a body breakdown injury that lands him on the DL. This would include a pulled hamstring, hernia, or hip injury. This occurred in 2008, 2012, and 2014.

The third option is some kind of freak injury. Breaking your hand while slamming your hand against the wall, or getting hit with a pitch would fall into this category. This occurred in 2008, 2010, and 2013.

The fourth possibility is that both injury types occur. As you can see, this happened in 2008 when he had a hamstring pull, and hurt his hand when smashing his bat against a wall.

I have assumed that he can not be out more than once for the same injury category. Knock on wood that he won’t.

So, in eight full seasons he has had no DL time three times, a normal DL trip twice, a freak injury twice, and both types once.

When not on the disabled list, Troy has played 936 out of 1002 possible games. That would average out to 151 games per season, if he could avoid the DL. Then we could model games he will play as a binomial distribution where P = 936/1002, which is approximately .93. This also means that the probability he misses a game is approximately .07.

When Troy goes on the DL, the number of days out will follow a normal distribution. If the DL stint is a normal injury, it will have a mean of 74.3 games with a standard deviation of 28.3 games. A freak injury has a mean of 23.7 and standard deviation of 8.2. When both injury types occur, there is still a normal distribution. In this case, the mean of games on the DL will be  sum of the two means and the variance will be the sum of the variances. So this will have a mean of 98 games and standard deviation of 29.4 games.

Because we have a distribution of games where he is automatically out because he is on the DL, it is easier to calculate the number of games out. In order to be out N games, we must calculate all of the ways he can be on the DL for a certain number of games, then miss the correct number of the remaining games to add up to N games. For example, to be out 100 games, he could be on the DL for 100 games and miss none of the remaining 62. He could also be on the DL for 99, and miss 1 of the remaining 63. This continues until the final possibility where he spends zero days on the DL, but sits for 100 games.

This can be written as:

clip_image002[17]

This can be re-written in Sigma Notation as:

clip_image002[22]

In a more general sense ,

clip_image002[15]

Where POutN is the probability he is out for N games. PDLi is the probability he is on the DL for i games, based on a Normal Distribution. PN-i,162-i is the probability he is out N – i games out of 162 – 1 games remaining, outside of a DL stint.

Once the calculations are done for each scenario, I combined them according to the probability that each occurs. So 3 times no DL, 2 times DL type 1, 2 times DL type 2, and 1 times both DL types. Then I plotted the distribution versus the number of games that would be played to reveal the following:

image

This graph looks slightly like a normal distribution skewed to the left, but with several peaks and valleys. The peak at around 152 games, corresponds to the mode and indicates the most likely possibility. The mean of the distribution is 116 games, which is slightly less than his average of 120. The median of the distribution is approximately 130 games. If you are going to bet on this, the median is the key number. This indicates that the probability of playing 130 games or more is equal to to the probability of playing less. The calculations also show that the chance that Tulo plays 140 games or more, is about 40%. I’d like that to be higher, but it’s definitely not a long shot.

To give more perspective, I have also plotted the overall model with the model for all individual injury scenarios.

image

There is one other possibility we have with this, that is to ignore the freak injuries. In this case, there will be 3 out of 8 seasons with a DL stint and 5 out of 8 without. Doing so, gives us the following graph:

image

This has a similar shape, without the small increase around 130. The mean of this is 125 games. Even better, the median of this is 148 games. This indicates that freak injuries have impacted Tulo’s injury history significantly. If they don’t occur, Troy will play a high number of games. So there is reason to be optimistic, even if the first model happens and not the 2nd. Hopefully that is what happens. In either case, if you’re betting on the number of games Troy Tulowitzki will play, take the over.

Thursday, August 26, 2010

Win Probability

One of my favorite baseball pages on the web is the win probability graphs at fangraphs. Simply put, these graphs show the probability of either team winning the chosen game after each play, based on historical results of identical situations. For example the home team is losing by two runs at the end of the 6th inning will win approximately 20% of the time. However if they are down two at the end of the 7th, they only win 15% of the time.

Here is the graph for today’s big comeback against the Braves. As you can see things were not looking good for the Rockies. It was a near lock until the Rockies scored three in the 5th to make it more manageable. Of course the real swing happened in the 8th inning, when Carlos Gonzalez hit the game tying single. Click on the photo to link to more details about the game.

Braves @ Rockies - Wednesday, August 25, 2010

The accompanying play log provides more detailed insight. I have copied an abbreviated version here with the details of the 8th inning.

PitcherPlayerInnOutsBaseScorePlayLIWEWPA
J VentersS Smith80___8-10K
1.8514.20%-0.05
J VentersC Iannetta81___8-10BB
1.319.80%0.057
J VentersM Mora811__8-101B
2.4927.80%0.08
J VentersE Young Jr.8112_8-10FC, 4-6
4.1318.80%-0.089
J VentersD Fowler821_38-10BB
3.4524.90%0.06
J VentersC Gonzalez82

123

10-101B
6.0461.20%0.363
K FarnsworthT Tulowitzki821_311-101B
3.8184.90%0.237
K FarnsworthT Helton8212_12-101B
1.1493.10%0.082
K FarnsworthM Belisle821_312-10K
0.6191.30%-0.018

Notice that as each runner got on base, the win expectancy (WE) slowly creeped up. Naturally it went down as each out was made. Of course the big blow was Cargo’s single which increased the probability of of Rockies win from 24.9% to 61.2%. This is also indicated by the win probability added (WPA) column which is .363. It should be noted, that while the three base runners who reached ahead of Cargo did not increase the win expectancy very much, they did each push up the leverage index (LI) so that Cargo’s at-bat had the significance that it did. In other words, Cargo’s hit was the critical play. However, Iannetta, Mora (replace by Young on the fielder’s choice), and Fowler reaching base set up his big chance. Clearly while those plays did not have the impact of Cargo’s single, it could not have happened without those other three guys getting on base.

In case you’re curious here are win probability graphs for some other famous games in Rockies history.

Wednesday, August 4, 2010

Performance Pie

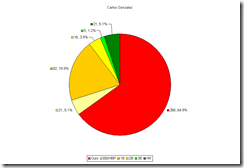
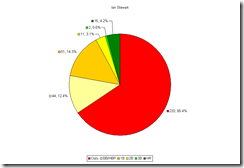
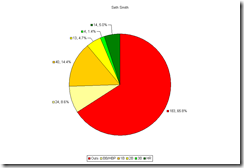
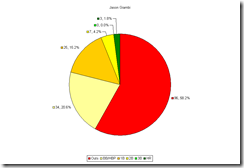
When comparing performance of different players, it can be easy to get overwhelmed by different numbers. So I’ve decided to take a more visual approach to evaluation. By using pie charts showing the six possible outcomes (walk, 1b, 2b, 3b, hr) for a batter and the percentage of plate appearances that each occurs, you can get a good idea of what a player has really done at the plate. Outs are represented by red, while the positive events are in various shades of yellow or green. Raw totals are shown along with the percentages that each event occurred. I’ve done this for this season’s performance (through Aug. 1) for all Rockies players with at least 100 PA’s this year. It should be noted that these charts do not necessarily predict future performance, only what has happened. (Click on the pics to enlarge.)

cg is
cb mo
tt th
df ss
bh rs
mm jh
jg ci

Some interesting things appear when the data is viewed in this way. Jason Giambi has the biggest slice of good events. This directly corresponds to having the highest on base percentage on the team. (The higher the OBP, the more good pie.) What is somewhat surprising as that the higher value events (2b, hr) occur less frequently then you might expect. However, there is still enough green and yellow pie there to not be considered punchless. Carlos Gonzalez’ chart shows that while he hasn’t done something good as often as some of his teammates, the value of what he has done has been very big. With a big chunk of orange, yellow, and green Carlos has clearly done a lot of damage. This also brings new insight to some position battles. Jonny Herrera and Clint Barmes have very similar proportions of red on their chart, however Clint has more green and yellow to Jonny’s orange. In other words, Clint’s advantage in the power department clearly comes through. Similarly, Brad Hawpe’s bigger cream section (walks) doesn’t quite measure up to Seth Smith’s bigger orange and dark green sections.

There are many different options that could be done with these. You could break outs down into strikeouts and outs in play, which would give you a rough idea of who is getting himself out and who is being put out by defenses. You could also have a chart for different splits, over careers or single seasons. I would really like it if others started using this approach to demonstrate player performance. Perhaps one of the big baseball websites that has the technology to do so can include these pie charts along with player profiles, to update with their stats. After all, there’s nothing wrong with having another tool to help us gain insight into player performance.

Wednesday, June 23, 2010

Was Chris Iannetta Afraid to Swing the Bat?

Before Chris Iannetta’s surprising demotion earlier this season, he had come under fire for not being aggressive enough. In particular, by one the Rockies’ tv commentators in a game about a week before being sent down. As a fan of patient hitting, I was pretty ok with Chris not chasing a low fast ball on the outside corner, that would have surely turned into a 4-6-3 double play if he had offered at it. The commentator was a lot quieter when Chris ended up with a base hit.

Having seen a lot of criticism about Chris being too patient, it got me wondering if the perception was true. Was he afraid to swing the bat? Looking at the following tables from Fangraphs, the answer up to this year was clearly NO.

Season O-Swing% Z-Swing% Swing% Outside Zone Total
2006 17.30% 75.90% 48.80% 175 203 378
2007 17.90% 70.60% 46.20% 432 502 934
2008 16.20% 72.30% 44.00% 853 836 1689
2009 16.70% 72.30% 45.60% 709 765 1474
2010 18.80% 68.70% 44.30% 69 72 141
Total * 16.80% 72.20% 45.30% 2239 2377 4616


Season O-Swing% Z-Swing% Swing%
2006 23.50% 66.60% 46.10%
2007 25.00% 66.60% 45.90%
2008 25.40% 65.40% 45.90%
2009 25.10% 65.90% 45.20%
2010 28.30% 63.90% 45.10%


The first of these tables shows Chris’s swing percentage outside and inside the zone (noted by O-Swing% and Z-Swing% respectively) as well as the total percentage of pitches swung at. The second part of the first table shows the number of pitches seen outside, inside, and total. This is all based on data up to Chris’s demotion.

Compare the first table to the second, which contains Major League averages of swing percentages over each year of Chris’s career. You’ll notice that Chris has been consistently good at not chasing pitches out of the strike zone, which shouldn’t surprise anyone. What me be surprising to some is that Chris is more aggressive on balls in the zone than the average major leaguer. It should be noted there was a slight decrease in pitches swung at in the zone. However, because of the sample size this means that he swung at only two fewer pitches than he normally would have. From Jim Tracy’s view that may have been all he needed to see, even if the stats don’t show the same urgency.

The next question we have to ask is “Has Chris become more aggressive since his recall?” The following table shows Chris’s swing rates since his recall.

O-Swing% Z-Swing% Swing% Outside Zone Total
30.07% 68.87% 46.19% 55 104 159

It practically jumps off the page. That outside zone swing percentage has gone up to over 30%. So Chris has become more aggressive, but not in a a good way. Strangely enough, his walk rate has been higher than usual at 21%. His K rate since then, also at 21%, is close to his career norm. Coincidentally or not, the one thing missing is the power. Chris has only 1 double in 36 pa’s since being recalled. Of course it’s probably too early to make any real conclusions out of that.

This is something worth following over the course of the year. Something tells me Chris won’t develop from a guy who has been criticized for being too patient, to someone who doesn’t see any pitches he doesn’t like.

Saturday, April 24, 2010

Rain Out

First off, I want to say how unfortunate it is that Rockies President, Keli McGregor, passed away earlier this past week. From what I know of him, he was very nice and sincere person. All the best to his family and friends.

It is somewhat fitting that we have dreary weather in the forecast for this weekend. Tonight's game got postponed due to rain/cold and will be made up tomorrow as part of a true doubleheader. I must say that I was disappointed to have the game called right I was getting to my seat, but I am pretty excited to go to the doubleheader tomorrow. I don't recall ever going to a doubleheader before, so this will be my first. I only hope neither of the games get rained out. Otherwise, I'll look forward to watching 'em play two.

Sunday, April 18, 2010

U-baldo!

I'm pretty wound up right now, but who could blame me after this happened. Looking back I wonder if people realize how special this is. Obviously, anyone should realize that it any no hitter is a big deal. It gets even bigger to throw the first in the history of your team, for any club. What really makes this special, is how miserable the Rockies pitching staff had been through most of the team's history. Until the past few years, the pitching staff was notoriously awful. Part of the improvement may be due to bringing in the humidor, but a large part of that was simply lack of pitching talent. Who can forget the immortal Jamey Wright or David Nied, and that legendary bullpen crew of Steve Reed, Darren Holmes, and Mike "Moonshot" Munoz? I certainly can't.

We've come a long way. We've gone from hoping the starter could hold the other team to less than 5 runs, to expecting quality starts every time out, and believing that a few members of the staff could throw a no-hitter. Now, it's actually happened. I for one won't forget Ubaldo's performance. More than that I won't forget the road the Rockies organization has traveled to have a starting pitcher who is even capable of throwing a no hitter, let alone actually doing it.

Saturday, April 17, 2010

Panic Time?!?!

This is always sort of a frustrating time for me to be a baseball fan. Every year it seems people get hysterical when someone gets off to a slow start, when they just need to relax and let things develop. There are a lot of examples of people jumping to conclusions base on small samples. Your centerfielder is hitting .190? Bench him? After 37 AB’s, probably not. Your team is playing .500 ball after 10 games, so turn the whole roster over? No. The team has scored 51 runs in those 10 games, and has scored at least 4 runs in 9 of those 10 games, so make drastic changes to the lineup? I don’t think so! The solution is to have some patience and let everything settle, if you will.

Earlier I read Dexter Fowler was a “liability” in the lineup, because of his .189 batting average, so I’ll use him as an example. Dex’s batting average has come in 37 at bats, which is pretty obviously not very many. So how many is enough to actually worry? We can build a simple hypothesis test for a player’s batting average based on his current average, and his number of at bats. Given Dex’s ability to get on base (which is the real thing we care about, and deserves more analysis later), he needs to bat at least .250 to be a useful part of the lineup. If I’m Dan O’Dowd/Jim Tracy I’m going to want strong evidence that he’s not before I hit the panic button. Assuming at bats follow a typical binomial pattern, we test the hypothesis that the player is a .250 hitter after n at bats. It turns out that the number of AB’s that a player batting .189 can have before we feel truly confident that he’s not at least a .250 hitter is 111. (I’m more than willing to explain my math, if anyone asks.) That means Dexter only has 74 more AB's to get his average above .190. Don’t worry, something tells me he’ll do it.